
9 Key Technical Indicators for Market Analysis
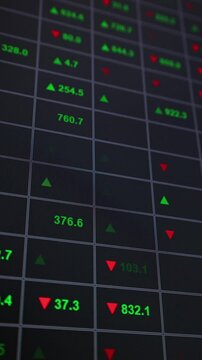
Technical analysis is the backbone of successful trading. These 9 essential indicators help traders identify trends, momentum, and potential entry/exit points:
- Moving Averages (MA): Smooth out price data to identify trends
- Relative Strength Index (RSI): Measure overbought/oversold conditions
- MACD: Moving Average Convergence Divergence for momentum
- Bollinger Bands: Volatility and price level indicators
- Stochastic Oscillator: Compare closing price to price range
- Fibonacci Retracements: Identify support and resistance levels
- Volume Indicators: Confirm price movements with trading volume
- Support and Resistance: Key price levels for decision making
- Candlestick Patterns: Visual representation of market sentiment